Ecommerce Customer Experience in 2026: Benchmarks, the AI Balance, and the Six-Touchpoint Playbook
Poor customer experience now puts an estimated $3.7 trillion in global sales at risk, 86% of buyers will pay more for a great one, and a third of customers leave after a single bad experience (59% after several). Meanwhile the companies on the other side of that spread grow revenue six times faster than laggards, because experience is where price competition goes to die: 89% of businesses now say they compete mainly on CX, and the typical experience investment returns about three times its cost within two years. This guide is the 2026 operating manual for ecommerce CX: the six touchpoints that actually decide the outcome (discovery and search, product pages, checkout, shipping, returns, support), the benchmarks that tell you whether each one is failing (CSAT medians, response-time quartiles, deflection ranges, NPS bands), and the honest AI picture, where the data says hybrid support at 82% CSAT beats both full automation at 71% and is closing on human-only at 84%.
It consolidates our scattered CX coverage into one pillar: what customer experience design is, CX strategies, CX management, CX analysis tactics, Shopify CX tools, live chat versus chatbots, and ChatGPT for customer experience.
The economics: why CX is a revenue line, not a cost center
The loyalty arithmetic has been consistent for years and got sharper in 2026 data. Existing customers spend about 67% more than new ones; a 5% improvement in retention lifts profits 25% to 95%; 52% of consumers make an additional purchase after a single positive experience; customers with a very good experience are 4x more likely to refer; and shoppers with smooth returns repurchase 3x more often. Flip side: 62% will switch brands after one poor experience, 61% switch over poor experience rather than product issues, and support quality shows up in repeat-purchase and lifetime-value data 60 to 90 days after the improvement, which is exactly the lag that makes CX feel unmeasurable until it is measured. Companies that actively track experience ROI are 94% more likely to achieve above-average growth, and omnichannel-consistent brands retain 89% of customers against 33% for single-channel ones. None of this requires new traffic; it is the same monetize-what-arrives argument our conversion rate optimization guide makes at the page level, extended across the whole journey, and it feeds directly into the recognition-and-trust flywheel our branding guide describes.
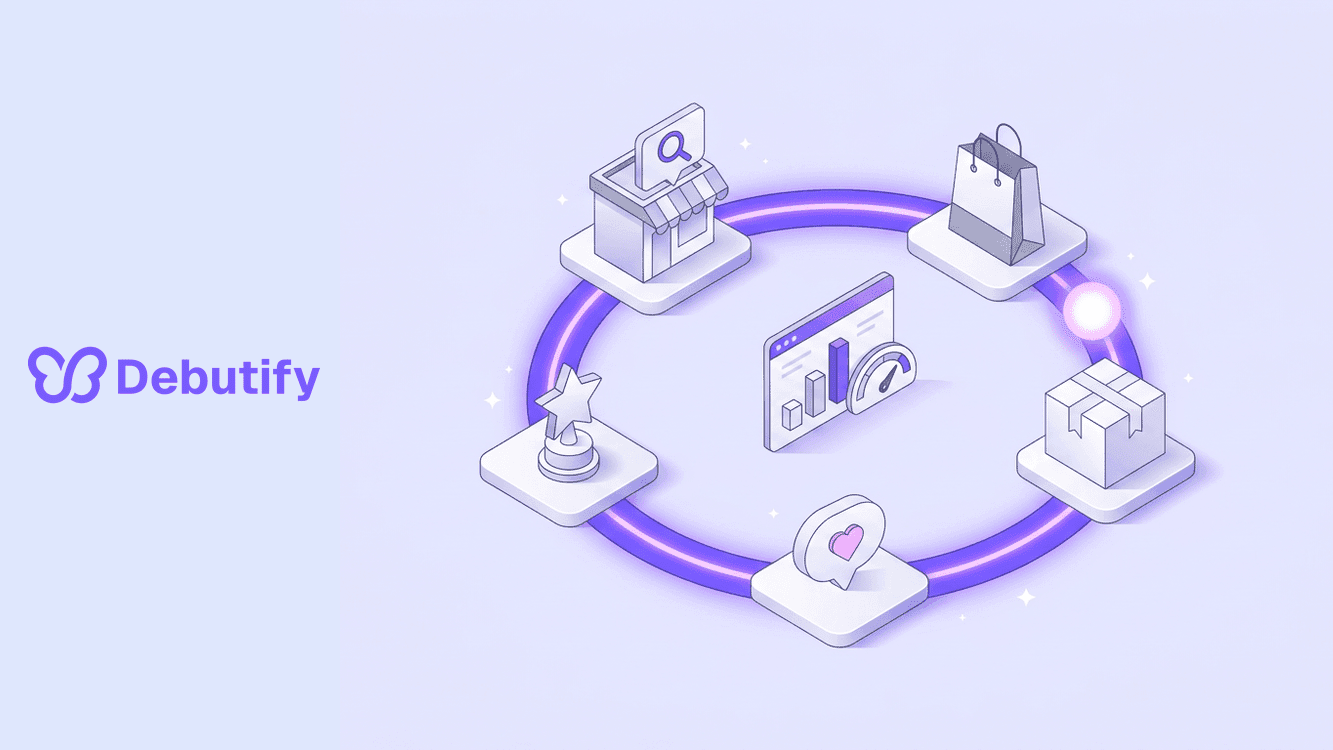
The six touchpoints, with the metric that judges each
| Touchpoint | What the customer is doing | Business outcome | Primary metric | 2026 benchmark |
|---|---|---|---|---|
| Discovery and search | Finding the product in their words | Qualified visits, add-to-cart rate | Search conversion, zero-results rate | Searchers convert 2-3x; zero-results under 5% |
| Product pages | Evaluating fit and trust | Conversion, fewer pre-sale questions | PDP bounce, repeated pre-sale questions | Pre-sale clarity is the cheapest return fix |
| Checkout | Committing money | Completion rate | Abandonment by device and payment method | Every friction point priced in revenue |
| Shipping and delivery | Waiting | Trust, ticket volume | WISMO ticket rate, estimate accuracy | Proactive tracking cuts "where is my order" volume |
| Returns and exchanges | Undoing a mistake | Retained revenue, repeat purchase | Return NPS, return-related contacts | Smooth returns = 3x repurchase |
| Support and self-service | Resolving exceptions | CSAT, operating cost | CSAT, first response, resolution time, cost per ticket | CSAT median 80-85%; details below |
Two touchpoints deserve emphasis because merchants underinvest in exactly these. Search and discovery: 43% of retail visitors head to the search bar and those visitors convert two to three times more, so the site search discipline is a CX program with a revenue line attached. Returns: a generous policy still feels hostile when the customer has to email support, print unclear instructions, and wait for manual approval; self-service initiation, plain-language eligibility, clear timelines, and status visibility turn the moment most likely to end a relationship into the one that, per the repurchase data, most reliably renews it. Proactive return handling (sending instructions before the customer asks) reduces return-related tickets by 40%, and the cheapest return of all never happens, because better product information before purchase prevents it.
The 2026 support benchmarks, by quartile
| Metric | Bottom quartile | Median | Top quartile |
|---|---|---|---|
| Email first response | 12-24+ hours | 4-8 hours | Under 2 hours |
| Chat first response | 2-5 minutes | 30-90 seconds | Under 30 seconds |
| CSAT | Under 78% | 80-85% | 88-93% |
| First-contact resolution | Under 65% | 68-75% | 80-88% |
| Ticket deflection (self-service/AI) | Under 10% | 15-25% | 30-60% |
| Cost per ticket | Over $20 | $10-$18 | Under $8 |
| NPS | Under 20 | 28 | 55+ |
Context on expectations: 68% of shoppers now expect a reply within two hours at any time of day, 38% expect support immediately, 81% try to solve issues themselves first (a strong knowledge base deflects 25% to 35% of inbound on its own), and channel choice moves satisfaction before you change a single answer: live chat runs about 87% CSAT, phone about 76%, email about 61%. Cost per contact spans an order of magnitude across channels, from $0.50 to $2 for a chatbot interaction to $15 to $25 for phone, which is why the routing decision is simultaneously a CX decision and a margin decision. Multichannel sellers feel all of this twice: 86% of brands now sell on two or more channels (earning 38% more revenue on average), support complexity compounds with each channel, marketplace SLAs like Amazon's 24-hour response requirement carry account-health penalties, and 75% of non-English speakers prefer support in their own language.
The AI balance: hybrid wins, and the data is unusually clean
Roughly nine in ten support teams now use AI in some form, but only about a quarter have integrated it well, and the 2026 benchmarks explain the gap. Fully autonomous AI resolution scores about 71% CSAT; AI-assisted support (the agent drafts, a human approves) lands near 82%; human-only sits around 84%. Full automation also has a hard behavioral ceiling: 45% of customers abandon a query after a single automated response, and deflection pushed above 50% with falling CSAT means the system is blocking customers rather than helping them. The winning pattern is layered: AI autonomously handles the safe, data-grounded volume (order status, return status, FAQs, roughly 30% to 40% of tier-one queries at industry average, 65%+ with purpose-built ecommerce AI), humans take the judgment calls, complaints, and anything where trust is at risk, and the handoff between them is designed rather than accidental. The same hybrid logic is reshaping the pre-purchase experience: AI personalization lifts conversion roughly 45% on average and outperforms rules-based personalization by up to 30%, with 76% of consumers now expecting personalized interactions, 78% more likely to repurchase after one, and 44% willing to switch to a brand that personalizes better, while 38% are annoyed by personalization done badly, which is why relevance beats cleverness. Our ChatGPT for CX piece covers the tooling layer, and the AI-visibility side of being found by these same systems lives in our AI visibility tools guide.
The rollout: what to measure first, and in what order
Week one is a baseline, not a transformation. Instrument five numbers: CSAT, first response time, resolution time, repeat contact rate, and revenue per ticket, each paired with actual conversation samples, because metrics tell you where the problem is while customer language tells you why. Then work the touchpoints in leak order: fix the search zero-results rate and the two worst product-page question patterns (pre-sale clarity), add proactive shipping notifications (WISMO tickets), launch self-service returns initiation (return NPS), and only then tune the support stack, deflecting routine volume to self-service and AI while protecting the human handoff. Track the lagging indicators on a 60-to-90 day window, since that is when support improvements surface in repurchase and LTV data, and report CX numbers inside the same ecommerce metrics dashboard as conversion and AOV so the program is judged on revenue, not sentiment. The reputation layer compounds on top: experiences get narrated publicly, and our search engine reputation management guide covers managing what the next customer reads about how you treat this one.
Frequently asked questions
What is customer experience in ecommerce?
It is the sum of every interaction across the journey: finding products (search and discovery), evaluating them (product pages), paying (checkout), receiving them (shipping), undoing mistakes (returns), and resolving problems (support). Each touchpoint has a measurable outcome, and together they decide retention, referrals, and lifetime value more than price does for 86% of buyers willing to pay more for a great experience.
What is a good CSAT score for ecommerce in 2026?
The median runs 80% to 85%, with the top quartile at 88% to 93% and anything under 78% in the bottom quartile. Channel matters as much as quality: live chat benchmarks near 87% CSAT, phone near 76%, and email near 61%, so where you invite customers to contact you moves the score before you improve a single answer.
Should I use AI for customer support?
Yes, in the hybrid configuration the 2026 data supports: AI-assisted or autonomously-handled routine volume (order status, returns, FAQs) scores about 82% CSAT, near human-only's 84%, while full automation drops to about 71% and 45% of customers abandon after one automated response. Automate the safe tier, design the human handoff, and watch deflection above 50% for CSAT decay.
How does customer experience affect revenue?
Directly and with a lag: existing customers spend about 67% more than new ones, a 5% retention gain lifts profits 25% to 95%, smooth returns triple repurchase rates, good support drives 20% to 40% more repeat buying showing up 60 to 90 days later, and CX leaders grow revenue about six times faster than laggards. Poor experience puts $3.7 trillion in global sales at risk and costs you a third of customers after a single bad interaction.
What should I measure first?
Five metrics in week one: CSAT, first response time, resolution time, repeat contact rate, and revenue per ticket, paired with conversation samples. Then add per-touchpoint numbers (search zero-results rate, checkout abandonment by device, WISMO ticket rate, return NPS) and review them inside your main ecommerce metrics dashboard so CX is judged on revenue, not sentiment alone.
Experience is the retention strategy
Every number in this guide points at the same uncomfortable truth: acquisition bought the customer once, but experience decides whether that purchase was the beginning or the end. The $3.7 trillion at risk is not an abstraction; it is a third of customers leaving after one bad ticket, 62% switching after one poor experience, and the 60-to-90-day revenue lag that hides the damage until the cohort data lands. The good news is that the 2026 playbook is concrete: instrument five metrics in week one, fix the touchpoints in leak order, let AI take the safe volume at 82% CSAT while humans keep the judgment calls, personalize with relevance instead of cleverness, and report all of it next to conversion and AOV so nobody mistakes CX for a soft initiative. Do that and the compounding is mechanical: smoother returns triple repurchase, better support lifts repeat buying 20% to 40%, and experience leaders grow six times faster, not because they spend the most on service, but because they understood earliest that in a market where 89% of businesses compete on experience, the experience is the product.

Author
Debutify
Debutify is the easiest way to launch and scale your eCommerce brand.