Small leaks sink big ships. And in eCommerce, those leaks often show up as unnoticed drop-offs, abandoned carts, or underperforming pages.
The only way to fix them is to first spot where they’re happening. That’s exactly what analytics can do for you.
Google Analytics (and tools like GA4 in 2025) give you clear visibility into customer behavior, traffic sources, and conversion paths. By focusing on the right reports, you can uncover bottlenecks, optimize your campaigns, and boost sales without wasting ad spend.
In this article, we’ll cover the five essential analytics reports every eCommerce business should track, and how each one helps you turn more visitors into paying customers.
What Is Google Analytics 4?

With GA4 now standard, it tracks customer journeys across devices and ties your marketing spend directly to ROI. Plus, it integrates seamlessly with Google Ads, YouTube, and other tools so you can make smarter decisions.
But here’s the catch…
Most store owners find GA4 intimidating. The interface is new, there are dozens of reports, and it feels complicated at first. If you can’t master it straight away, you’re not alone.
That’s why focusing on Google Analytics Reports matters. Reports highlight where customers drop off, which campaigns convert best, and what drives retention. They directly influence your conversions and are easier to set up than you might think.
So, if you want to optimize your sales funnel in 2025, GA4 reports are the place to start.
So what are Google Analytics reports?
Google Analytics Reports

You can find preset standard reports on the left-hand sidebar of your dashboard. You have five options there, including:
- Realtime
- Audience
- Acquisition
- Behavior
- Conversions
(Source)
Let’s discuss each option…
1. Realtime Report
The name says it all.
With real-time reports, you can track what’s currently happening on your site.
For example, you can see how many visitors you have on your site.
It also answers the questions: What specific pages are they visiting? Where are they located? And from which social channels are they coming from?
Sure, these metrics look interesting. But these give you insights into basic (aka least valuable) information. The other options pack a far greater punch.
Not sure what am I talking about. Let’s find out...
2. Audience Report
This one’s my favorite. With an Audience Report, you can have an overview of your current market standing.
I mean, it gives you a sense of how your brand or product is trending overall.
The menu comes loaded with no fewer than 15 sub-headings sitting within it.
From demographics to interests, you can find almost everything under this tab.

Then we have Acquisition reports...
3. Acquisition
Curious to know from which specific acquisition channels you’re getting most of your traffic from?
The Acquisition report perfectly breaks this down for you.
Do you get more traffic from organic sources or through your email or paid search channels?
Based on the results, you can focus on channels that contribute less to your site traffic.
Up next is...
4. Behavior
Just like the Audience report, the Behavior tab also gives an in-depth insight into your blogs and landing pages.
An ‘All pages’ option allows you to review the top-trafficked pages on your site. Then there’s content drill down. This enables you to see the data of each of your subdomains.
You can also use landing pages, exit pages, site speed, site search, and countless other options to keep an eye on your site’s behavior.
It's literally leaving you no margin for error. How cool is that?
Need conversions? Then you may want to check out the next option that talks about conversions and revenues.
5. Conversions
It's okay if your only goal is to improve conversions and have more sales. After all, you’re spending your time, money, and effort to accomplish your monetary goals.
Sure, you’ll be missing out on long-term gains when you focus on short-term goals. But conversions are essential. In fact, that is the only purpose of your business's existence.
The good news is Google Analytics can help you achieve your conversion goals as well. This will help you stay on top of everything, from how to optimize your ad revenue to how to get more people on your mailing list. The options are limitless...
You can find four goals under the conversion section.
Let’s see what these options have in store for you.
Destination: You can keep track of the users who reach a specific page.
Event: You can define the desired event. For example, when a person shares your post with their friends.
Duration: When a visitor’s session lasts longer than your preset time.
Screens per session: When a user views a set number of screens per session.
Phew, that’s a lot to take in, right?
But, don’t worry, you don’t need to generate or review every report on Google Analytics.
Yup, that’s right. Because I’ve pulled together a list of...
5 Key Analytics Reports You Shouldn’t Miss Out On
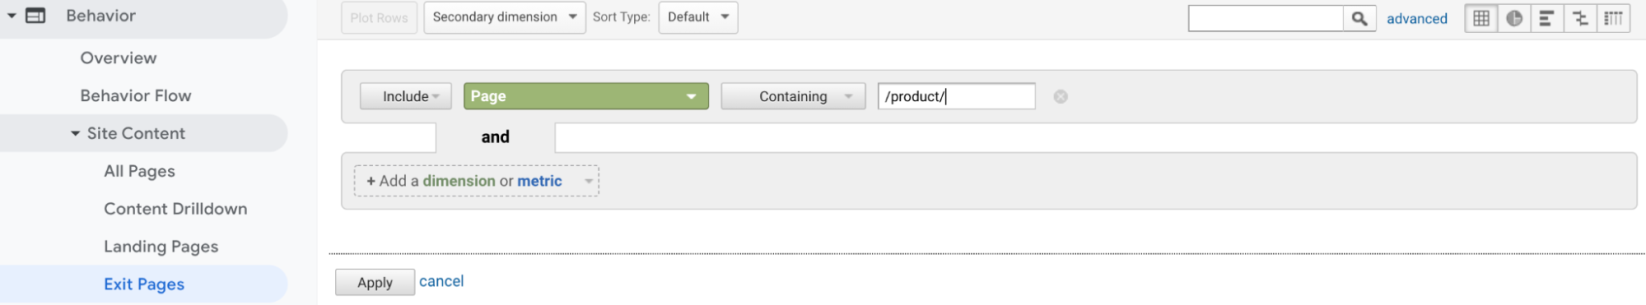
1. Exit Pages Report
There are pages on your site on which most of your visitors choose to exit. Running the Exit Pages report will show you a clear picture of everything.
To generate this report, all you need to do is:
- Access your Google Analytics dashboard
- Click ‘Behavior’
- Select ‘Site Content’ and click ‘Exit Pages.’
(Source)
What’s next?
Review those pages to figure out where exactly visitors are exiting.
If your product pages have the maximum bounce rate, you have to redesign them for better conversions.
I am talking about rewriting content and reshuffling the placement of your CTAs and other important info.
If possible, consider adorning your pages with high-quality imagery and videos.
If it’s your checkout pages, you have to optimize them for a seamless experience.
Review if you’re not offering enough delivery or payment options. Customers also dislike long or complex checkout procedures. Give it a thought and make adjustments.
You can also improve your conversions by generating a ‘sessions by device' report. Here’s how it works...
2. Sessions By Device Report
Your website shines on desktops. But what if it performs poorly on mobile devices?
Even worse, most of your traffic comes from mobile devices, tablets, or phablets.
The Sessions By Device report will help you identify what devices your customers use to visit your site.
Let’s suppose you get most of your sales from mobile shoppers. To streamline their experience, you can rethink your conversion strategy and focus more on mobile optimization features.
Wondering how you can generate this report?
Follow these steps, and you’re in place…
- Click ‘Audience’
- Click ‘Mobile’ and then ‘Devices.’
In case of low conversion on specific devices, you may need to review each device’s UX.
Now, adjust your optimization strategy accordingly. You’ll see your conversions improve in no time.
3. Conversions Per Browser Report
Did you know the most common conversion leak for an eCommerce website is its incompatibility with different browsers?
Sometimes you’re counting on your developer’s efforts. But the data tells a different story.
Have a peek at your conversion rate per browser. Skim through each browser version separately.
Here’s what you can do to view this report:
- Click ‘Audience’
- Tap 'Technology,’ and then ‘Browsers and OS.’
Don’t ignore fringe browsers, assuming no one uses them. Remember, sometimes small things make the most significant difference.
You can skyrocket your conversions when you know what’s going on inside your customer’s minds. No, it’s not magic. You just have to give the Site Search report a try...
4. Site Search Report
Site Search reports allow owners to track what their customers are tracking using internal search.
You can discover your site searches following these easy-peasy steps:
- Click 'Behavior'
- Click ‘Site Search’ and then ‘Overview.’
Using this report, you can find out those hidden gems you weren’t aware of. You can also find out what your customers are saying about your products.
Using this data, you can rename and rewrite your product titles and descriptions better.
We’re down to our last option (the most important of all, I must say)...
5. New Vs. Returning Report
While it’s thrilling to see new traffic rolling in, repeat visits validate your product’s potential.
Guess what?
It is possible to track this metric using Google Analytics' feature: New vs. Returning report.
- Check into your Google Analytics dashboard
- Click ‘Audience’ and then ‘Behavior’
- Tap 'New vs. Returning’
That’s it!
Why is this report important for conversions? Because new visitors are likely to take some time getting familiar with your offers. Existing customers add 65.16% more items to their carts than recent visitors.
Also, they convert 73.2% more than new leads.
The bottom line?
Use different tactics to engage your new customers. However, don’t try to hard-sell your offers to them.
But leave no stone unturned in providing a flawless and personalized experience to your loyal customers. They deserve it!
6. Digital Experience & Session Replay Report
While Google Analytics tells you what is happening on your site, it often leaves you wondering why users are dropping off. To truly understand your conversion barriers, you need to see the customer journey through their eyes. This is where Fullstory excels, providing a detailed look at every click, scroll, and mouse movement.To leverage these insights for your store:Access your Fullstory dashboard.
Search for "Rage Clicks" or "Dead Clicks" to find immediate friction points where users are getting frustrated.
Review session replays for specific high-value pages like your checkout or product pages to see where users hesitate.By watching how users actually interact with your site, you can spot the "invisible" bugs and UX hurdles that traditional analytics miss. Whether it's a button that's hard to find on mobile or a form that's too complex, these behavioral insights allow you to make the precise adjustments needed to turn frustrated visitors into happy customers.
Improve Conversions Using Real-Time Analytics
There you have it -- 5 key data analytics reports you can use to earn more conversions.
Tracking conversions is excellent. But all your efforts will go down the drain if you fail to fill the loopholes at the right time.
That’s where Debutify’s Conversion Triggers step in.
Whether it’s about improving your site search or speed, our conversion-focused add-ons will streamline everything for you and help you increase your conversions.
Skyrocket Your Conversions With Debutify - Today!
14-Day Free Trial. 1-Click Installation. No Credit Card Needed.