
So, you want to improve your eCommerce conversion rate.
You tried new advertising strategies...
You already made your product descriptions better...
But they still don't seem to work and you don't know why.
This can be frustrating, of course... especially if your competitors are succeeding despite selling almost the same products.
And one of the reasons is your website UX or landing page.
You see, even if you're selling the same products as your competitors, you don't have the same website.
But hear me out...
I'm not saying you should copy your competitor.
Because there is a way to find what will work best for you!
And that is through heatmap analytics.
If you haven't heard of it, you're missing out.
But no worries, because this blog will tell you...
- What is heatmap analytics?
- Why should you use heatmap?
- How does it work and what are the 4 types of heatmaps that will help you analyze?
- How can you use the data you gathered to improve your conversion rate?
In short, heatmaps will help you build a conversion-friendly eCommerce store.
To make it easier for you to understand the heatmap, let's start by discussing...
What Is Heatmap?
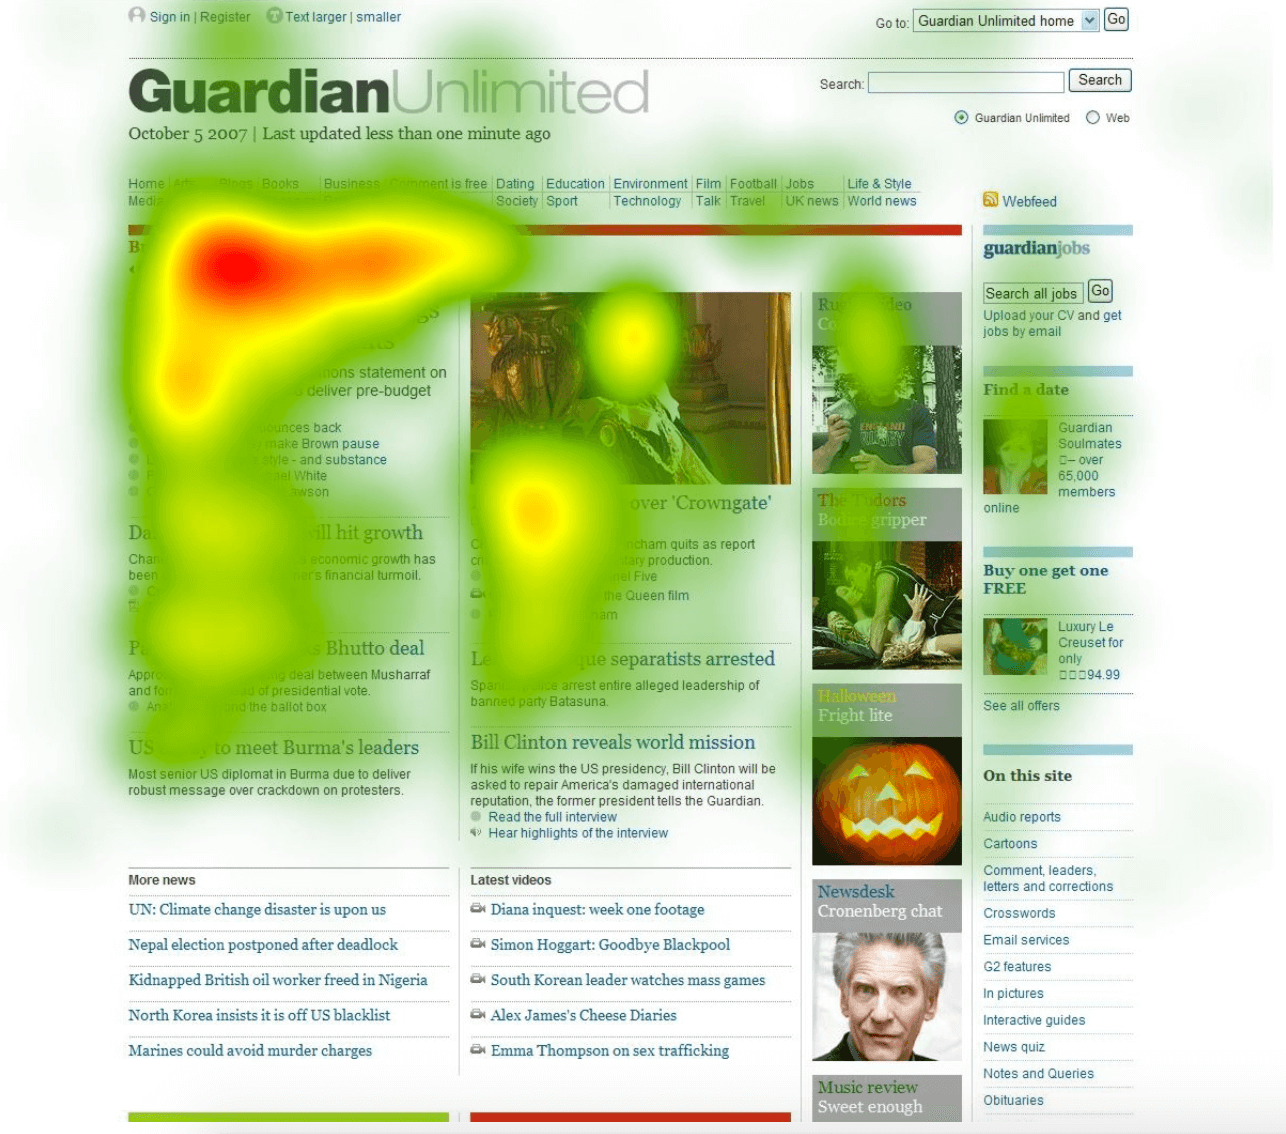
Heatmap is a data visualization technique that allows you to analyze your visitors' movements on your website.
It gives you a visual overview of what your visitors are clicking on your website.
Here's what it looks like:
(Source)
Heatmaps are based on colors, too.
The color of each area will change once they're clicked. The brighter the color, the more people click on that area of your website. That's where your users interact the most.
Now that you know what heatmap is, you need to know...
What Are The Benefits Of Using Heatmaps?
There are other ecommerce data analytics tools out there, but why should you consider using heatmaps?
Here are three reasons why. Heatmaps can...
1. Show You The User's Behavior
Since it's visual, you can easily see what your visitors are doing when they're on your website.
You can see where your visitors are clicking the most and what are the buttons that aren't getting a great number of clicks.
Heatmaps can show you the users' behavior to...
2. Allow You To Optimize Your Website
Once you see that some things aren't getting attention, it's time to optimize your website.
And this is not a one-and-done thing. You constantly need to improve your website for better results.
So, using heatmaps as a basis for what you'll change on your website can...
3. Increase Your Conversion
Of course, you need to use the data you gathered properly.
After making the necessary changes, you can achieve your business goals... such as increasing your conversion.
These are why you should use heatmaps analytics tools.
You can see the user behavior and use it as a tool to achieve your goals.
But wait...
How Do Heatmaps Work?
To understand how heatmap analytics works and use it, you need to know a little bit about the "technical side" of it.
Heatmaps collect data from a web page. Since it's color-coded, the scale ranges from dark to light colors.
And as I said, if there are brighter colors, it means there is a high interaction in that area.
There are also different types of heatmaps.
What Are The Types Of Heatmaps?
Here are some types of heatmaps you can use to interpret your data.
1. Click Maps
Click map is the most common type of heatmaps. This detects where your users are clicking when browsing your eCommerce website.
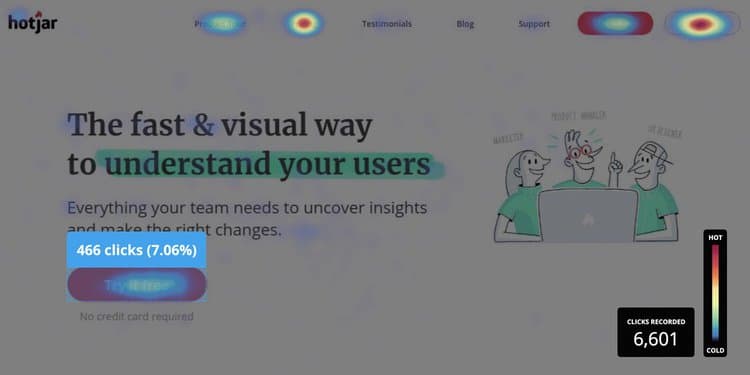
(Source)
With click maps, you can see where users are clicking on your website. This is a great way to find where your visitors interact the most.
And when there are little to no clicks on some "important" buttons, you need to make some changes.
Next is...
2. Scroll Maps
Scroll maps indicate the scrolling actions of your visitors on your website.

(Source)
You can see where your users scroll and use that data to see if the length of your web page is ideal for your target audience.
For example, if only less than half of your landing page has darker colors, it means users only stay in that area of your page.
That's how a scroll map would help you analyze user behavior.
Another one is...
3. Eye-tracking Heatmaps
Eye-tracking heatmaps indicate the attention each section or element captures on a website.
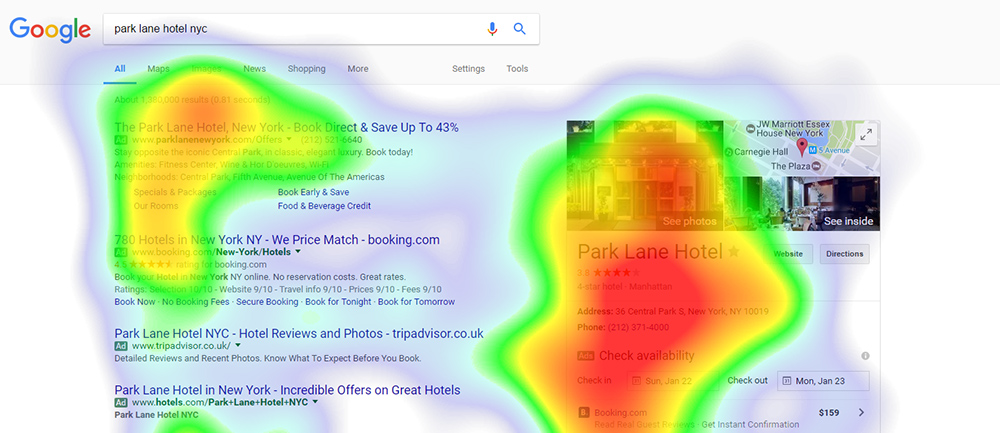
(Source)
There are two types of eye-tracking maps, which are:
- Fixation volume heat map: it shows the section of the page with a large number of eye fixations. It's recorded if a user looks at a particular spot for over 50 milliseconds.
- Fixation duration heat map: it indicates how long a user looked at a particular element of the website.
Eye-tracking heatmaps will help you analyze if the dynamic elements of your website are in order.
And lastly...
4. Mouse Heatmaps
Mouse heatmaps will help you indicate where your users click, hover, scroll, and pause when they're on particular web pages.
.png)
(Source)
It's also called "move maps" because it shows where your visitors are moving their mouse.
This is also an excellent way to measure how and where your users engage the most on your web pages.
I'm sure you want to get to the juicy part now...
How Can You Use The Data To Improve Your Conversion?
Once you have all the quantitative data and graphical representation you need, you have to use them correctly.
So, based on your findings, you need to make some changes.
Some changes you can implement are...
💡 Change The Button Placements

If a particular page is not getting the click it needs, this may be one of the changes you need to implement.
For example, your home page. You placed the button at the upper left of the website, but it's not getting a lot of user clicks.
This means you may need to adjust some of your button placements where users navigate mostly based on your click data.
Are they clicking or hovering on the center part of your website? You might need to put your button there.
It depends on the data you have and the key elements of your website.
As long as your visitors can easily take your desired action, you can reach your goal.
You may also need to...
💡Improve Your Call-To-Action

You may have the best button placements... but they're still not yet clicking.
You should take a look at your CTAs.
Do they have these three things?
- Urgency
- Attention-grabbing design
- Persuasiveness
If not, you should write better CTAs that will make them take your desired action... which is conversion.
A persuasive call-to-action will make it hard for them not to click that button. 😉
But before you can make them click, you need to...
💡Write A Better Sales Copy

What if your customers are just scrolling through your website? Are they not clicking on anything? Or not even looking at the same page for long.
This may indicate one thing...
You are not keeping their attention.
Sales copy is one of the most important elements for website owners.
That's why you need to write a better sales copy that will capture their attention and take action.
Or better yet...
💡Enhance Your UX Design

Enhancing your overall UX design is important to ensure the efficiency of your website.
Web development is not a one-time thing.
You need to enhance your website from time to time to make sure everything is working perfectly.
Check all the button placements, web copy, CTAs, how the website works on a mobile device, and more.
And through heat maps, it will be easier to enhance your website because you have data to guide you.
But to test its efficiency, you can...
💡Conduct An A/B Testing

A/B testing means testing two different variants of your website to see which one works well.
For example, on one variant, your website's button is placed in the upper left corner. While on the other one, it's in the center.
Once you get the results from the website heatmaps, you'll see which one got the most clicks.
And you'll use that information to revisit and adjust the dynamic elements of your website.
Having a website heatmap is so helpful, right?
So, how can you get or install a heatmap tool?
How To Install A Website Heatmap With Google Analytics?
As we know, Google Analytics is one of the best analytics tools for your business.
You can see different eCommerce metrics, such as conversion, session recordings, page views, bounce rates, etc.
But you can also use GA as a heatmap tool.
Here's how:
1. Install the Page Analytics extension by Google
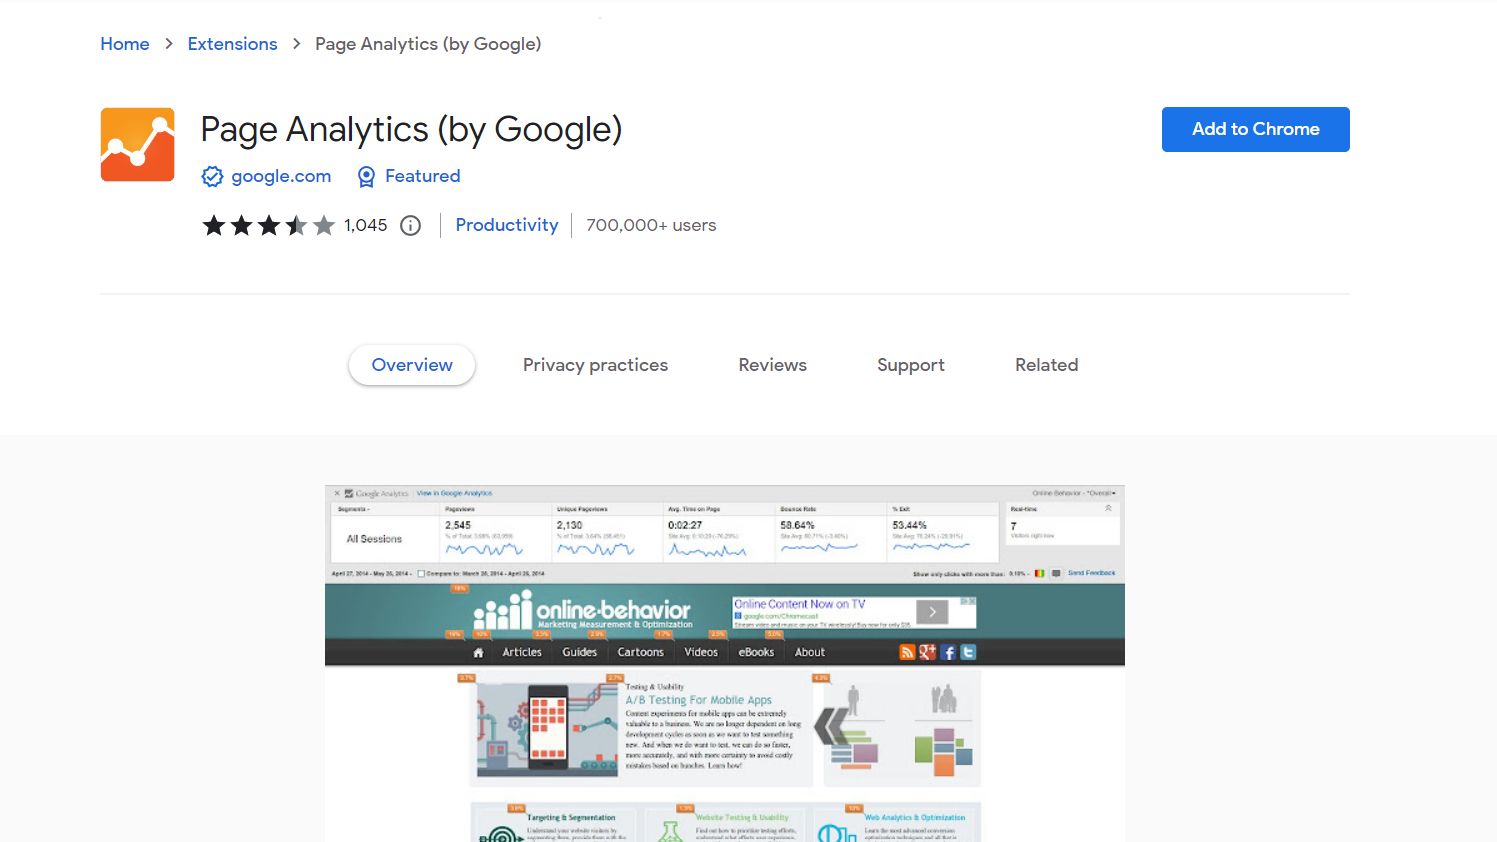
Heads up!
There are reports of it not working perfectly fine. So, if this doesn't work for you, I will give you alternative heatmap tools at the end of this blog.
2. Set up your account in Google Analytics
Paste the tracking code on your website and input the URL you want to put a website heatmap on. If you already have the Page Analytics tool, Google Analytics will provide all the data you need.
3. Segment your website visitors
Add up to 4 segments, like organic traffic, referral traffic, returning users, paid traffic, etc.
4. Adjust the configurations
Adjusting this will reflect the data you want to see. You can adjust the date, see all or real-time visitors, and more.
5. Analyze the data
Once you set the configurations, Page Analytics will generate your website heatmap analytics in real-time.
You can choose colors, which will show the user's actions through colors.
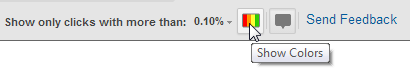
Or bubbles, which will show the percentage of user actions.
.png)
See? It's easy to set up a website heatmap!
But there are still other heatmap tools you can use...
💻 Heatmap
Heatmap is a heatmap software that will you track your data.
It's easy to set up! Just sign up, input the URL of the website, and choose a plan. They have a free plan for you to start with.
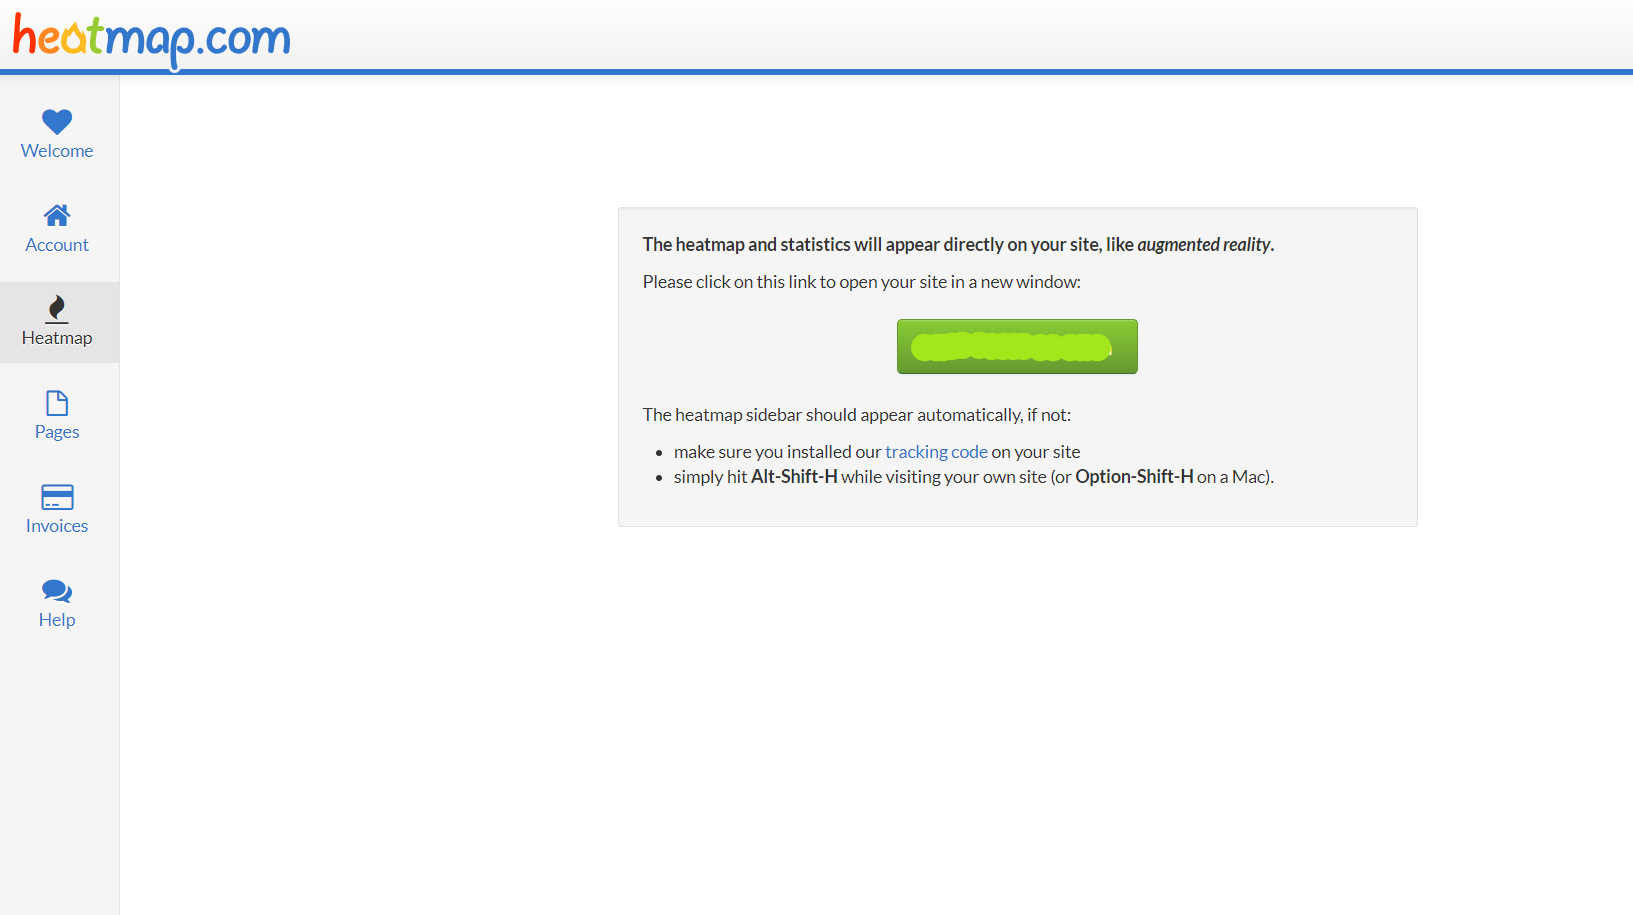
Just make sure to install the tracking code.
Another heatmap software is...
💻 Inspectlet
This is one of the best heatmap tools because they have eye-tracking, mouse, and scroll heatmaps.
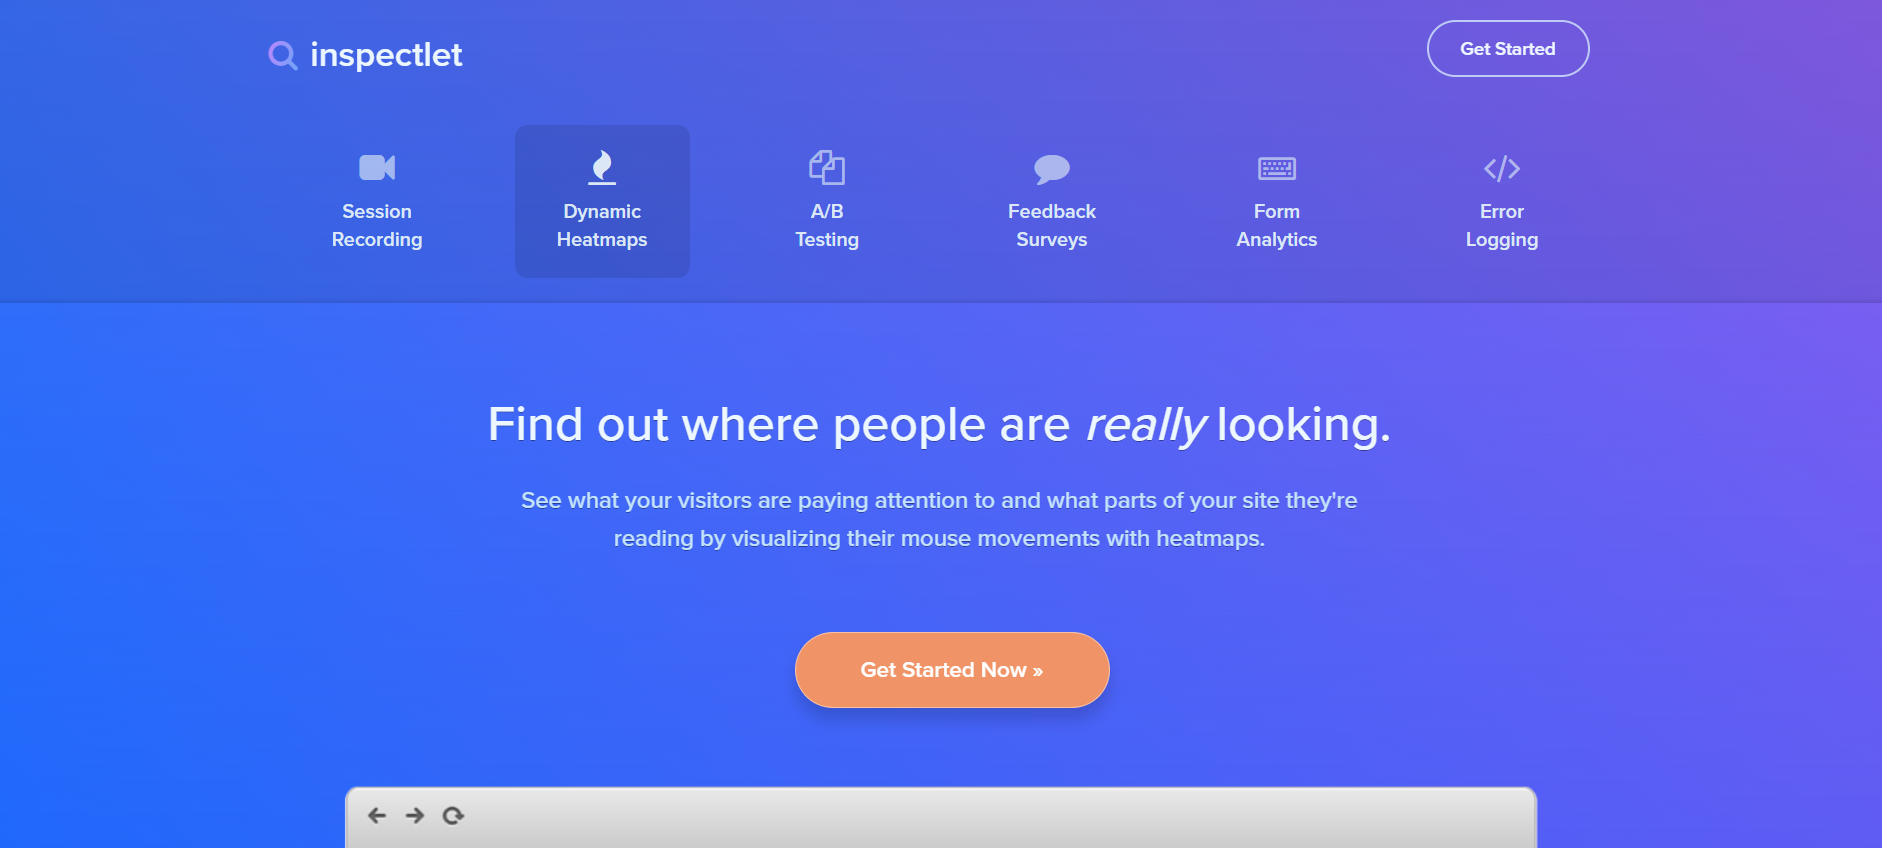
With this kind of ability, it's no surprise that this is a cost-effective heatmaps analytics tool you can use.
What are you waiting for?
Use Heatmaps To Enhance Your eCommerce Store!
At first, heatmaps can be overwhelming to look at.
But with the right interpretation, you can use the data properly to enhance your eCommerce store!
And to make your life easier, you need to install an eCommerce theme that is already user-friendly.
Debutify can be the answer.
It's an eCommerce theme that is user-friendly, which your visitors will love.
It also has over 50 Add-Ons to optimize your profits, AOV, and...
Improve Your Conversions With Debutify - For Free!
14-Day Free Trial. 1 Click Installation. No Credit Card Required.


 Ricky Hayes
