Ecommerce data analytics might be overwhelming at first glance...
(Source)
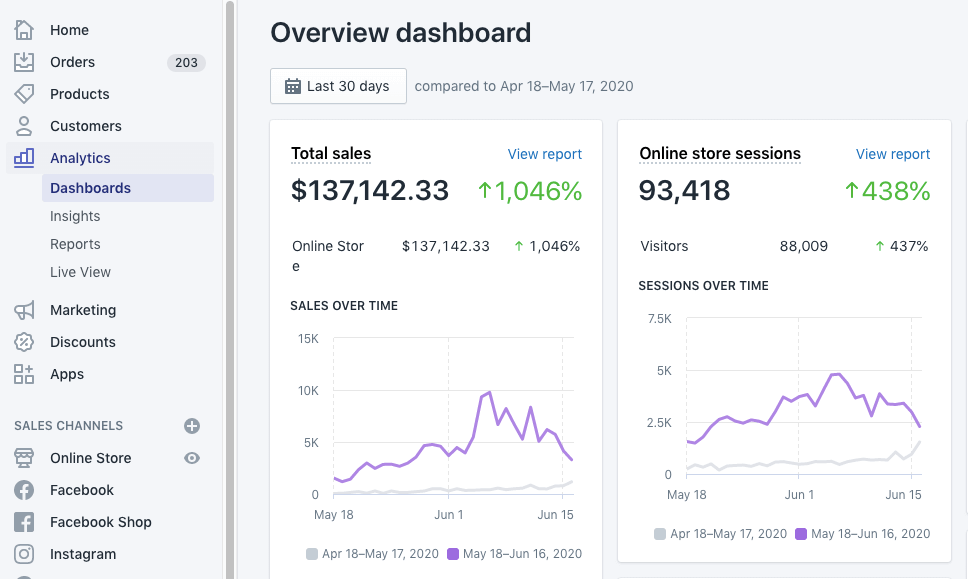
And as you're looking at your ecommerce analytics tool... you see different results or different colors...
And you are probably aware that these colors mean positive and negative results.
See, having these numbers is well and good.
But, If you don't know how to interpret it, it can bring you and your team more confusion.
See, knowing these numbers is not enough. You have to know HOW to interpret it...
So, in this blog... we're going to discuss everything you need to know about ecommerce analytics.
From the possible metrics, you might encounter... to the best ways of understanding them so you can implement changes!
Now... let's dive right in!
What Is Ecommerce Analytics?

Ecommerce analytics consists of the data of your online store. It includes sales, orders, profits, and the like —any possible areas within your ecommerce store.
And it also has different metrics... such as acquisition, retention, order value, etc. Which I will be talking about later, so stay with me!
There are different ways to find your ecommerce analytics. You can find it on Shopify Reports, Google Ads, and even Instagram's Professional Dashboard.
Most platforms have free analytics reports, but there are some platforms where you have to pay.
But to sum it up, understanding your ecommerce analytics is important for your ecommerce store. It can help you choose which action or direction you can take in the future.
Let me tell you why.
Why Do You Need To Keep Track of Your Analytics?

1. To Measure The Success Of Your Campaigns
One way to see if your marketing campaigns are successful is by analyzing your data.
This will help you determine which ones contribute to the success of your ecommerce store. This way, you would know how well your marketing campaigns are performing.
And if not, it's time to...
2. Optimize Your Overall Strategy
This is one of the benefits of tracking your analytics.
If you see something that isn't working, it's time to enhance your strategy! This includes both marketing and sales. Even your pricing strategy!
The next benefit is...
3. Evaluate Customer Behavior
Knowing how ecommerce analytics works can help you identify customer behavior.
And if you know this, you'll be able to make data-driven and knowledgeable decisions. Because you understand what the analytics say.
See? These benefits could help you reach your goals. And speaking of which...
What Is The Difference Between KPI, Metrics, And Analytics?
KPI is a Key Performance Indicator. It's going to help you set your goals because these are what you're using to measure the success of your marketing campaign.
For example, you can use the number of social shares, conversions, and traffic as your KPI or Key Performance Indicators. You can use these to track your campaign progress or if you're reaching your goals.
So, metrics are usually the type of data you're tracking. These are page views, sessions, behavior, etc. They are what's measured in analytics.
That means analytics is the "analysis of data." Data analysis consists of the total number of metrics... such as conversions, acquisition cost, average order value, and other possible metrics.
You can use ecommerce analytics to make proactive and informed actions on your ecommerce store.
So, before we hop on how you can understand ecommerce analytics... let's talk about the metrics you need to understand first.
Ecommerce Metrics You Need To Learn About To Help You Understand Your Analytics
You can find these metrics on Google Analytics, Shopify Analytics, or you can compute them yourselves.
Here are some...
1. Customer Lifetime Value (CLV)
Customer Lifetime Value is how much your customers are worth throughout your relationship with them.
This is an important metric to track. Why? Because it costs less to keep your current customers than acquire a new one. And it plays a crucial role in profitability.
But how to compute your CLV or Customer Lifetime Value per year?
.png)
You have to multiply the average purchase value, the number of times the customer buys from your ecommerce store, and the retention period.
Checking your CLV is essential because it helps you know which area needs improvement. But remember, it can change from time to time.
That's why you need to check and understand your ecommerce analytics to make adjustments.
Next is...
2. Customer Acquisition Cost (CAC)
Customer Acquisition Cost or CAC is the cost of acquiring a new customer.
This includes the resources, salaries, or other fees you need to spend to acquire new customers in your ecommerce store.
Here's how to compute it...
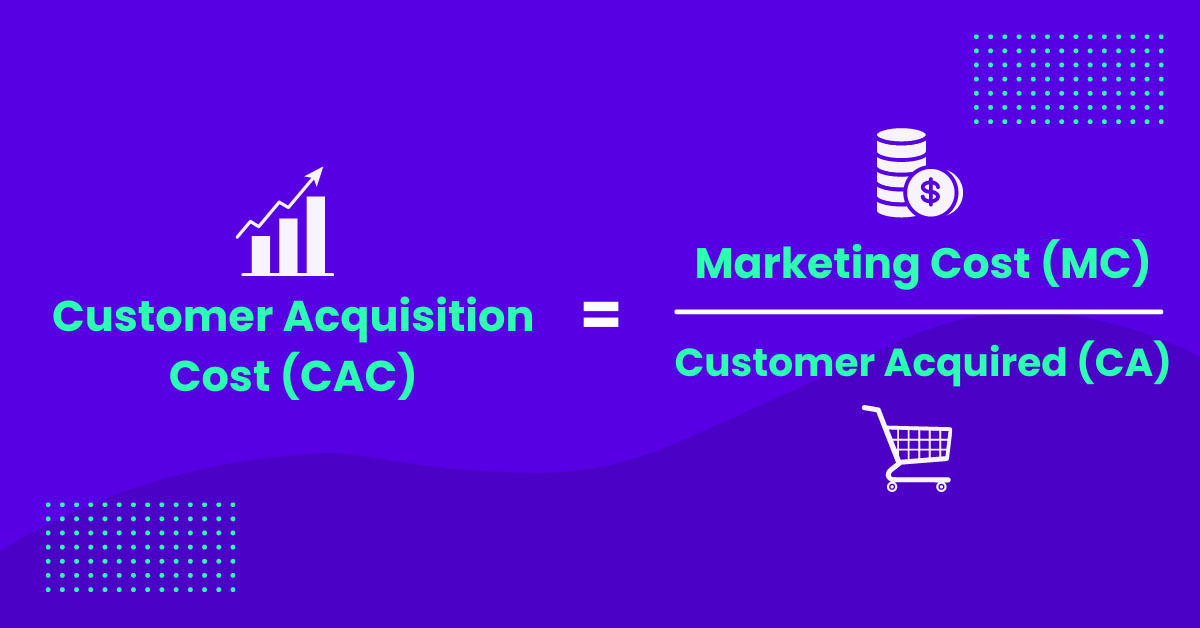
As you can see... if you want to compute your own Customer Acquisition Cost... you need to divide your Marketing Cost (MC) and Customer Acquired (CA).
Let me give you an example.
You need to break down how much you spent on your marketing cost.
So, take note of these... your employees' salary, software, tools, advertising fees, and more. Then let's suppose that the total of your Marketing Cost is $7,000.
But despite the cost, you were able to acquire 70 new customers for the month of December.
If we divide that, your Customer Acquisition Cost is $100.
Now, this is an important metric because it helps you determine how much you're spending on getting new customers. You can adjust your budget anytime, depending on your CAC!
Another metric is...
3. Average Order Value (AOV)
Average Order Value or AOV is another metric you need to track on your ecommerce analytics.
It's the average amount of how much your customers spend on your store. And it helps you determine the purchasing habits of your customers or consumer behavior.
Now, here's how to compute it.
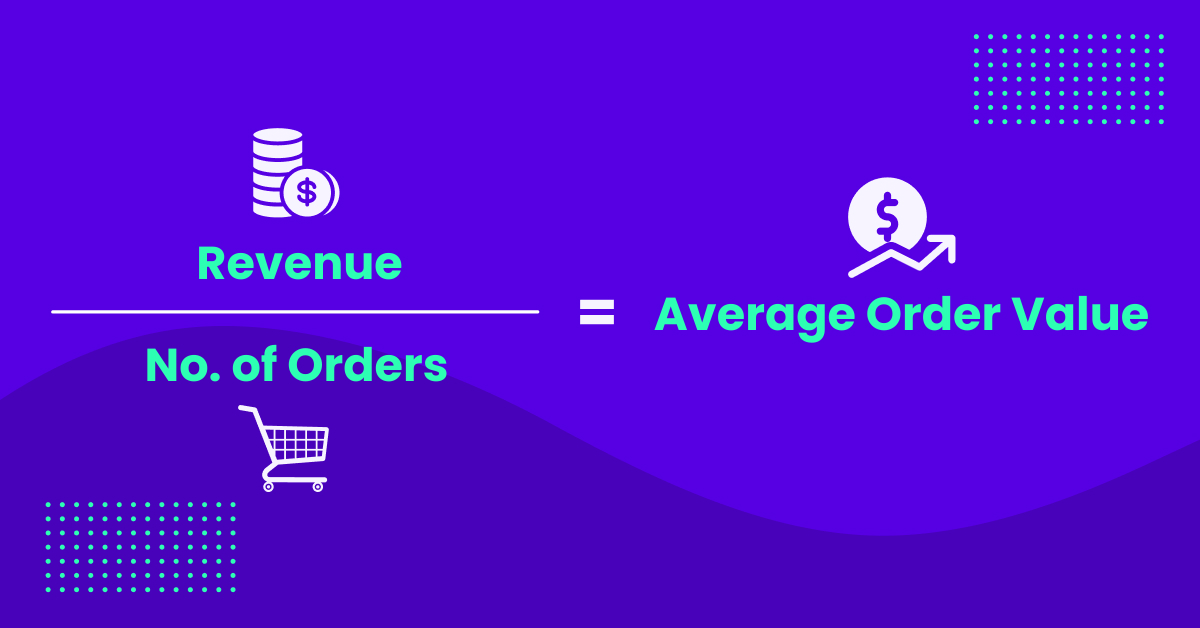
Just divide your revenue and number of orders. Then, that's it!
The key to improving your Average Order Value? Understanding what it means so you can optimize your marketing efforts!
The next metric you need to keep an eye on is...
4. Repeat Customer Rate
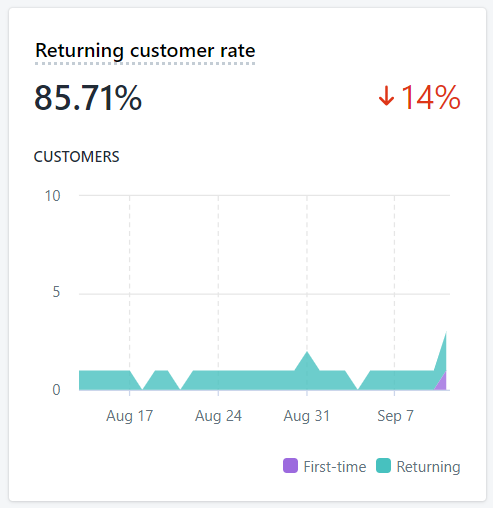
(Source)
Repeat Customer Rate is how many of your customers placed orders more than once on your Shopify store.
This is an important metric because this measures your Customer Retention rate. You need to see if your customers are coming back to you. Or why they're not.
And once you know this... enhancing your marketing efforts to increase your retention rate or loyal customers won't be rocket science!
Where to find this, anyway?
You can find your Repeat Customer Rate on your Shopify dashboard. It's called Returning Customer Rate.
Another metric is...
5. Online Store Visits
(Source)
Online Store Visits is the number of visitors your ecommerce store has in a specific time frame.
This is a metric you need to consider because it determines how many people you're driving into your website. So, if ever there's a poor number, you'd know when to optimize your marketing strategy.
You also need to keep an eye on the source of traffic. Is it social media? Google ads? Facebook ads? Or from your influencers?
If you want to increase your online store visits, make sure to deep dive into your analytics.
The next one is...
6. Pages Per Session
This is usually from Google Analytics. Pages Per Session measures the pages a user views every time they visit your ecommerce store.
In Google Analytics, you can see the average result already. It's calculated by dividing the number of page views and the total number of users or visitors.
You can view this on your Acquisition Overview Report.
And the last example is...
7. Bounce Rate
Just like Pages Per Session, you can access this metric on Google Analytics.
But what is Bounce Rate? This is the total percentage of users who leave your ecommerce store without taking any action.
The reason why you need to track this is so you can determine what's wrong. Why are visitors not taking any actions on your website?
If you can understand these analytics, you can improve your results.
So, hear me out... these are just some metrics you need to understand when visiting your analytics. There are more metrics you need to measure aside from our examples.
But what if you don't understand what to do with them?
Don't worry... because I've got you covered!
Best Ways To Understand Your Ecommerce Data Analytics
1. Learn The Metrics
You may have saved some time because you have already read some metric examples above. But this is an important way to understand your analytics.
If you don't know what they mean, you won't be able to deep dive into them and see how you can improve them.
Another way to understand your ecommerce analytics is...
2. Gather Your Data In One Place
If you're using different platforms or marketing channels to see your reports... this can be an effective method to help you.
For example, if you're also using Google Analytics aside from Shopify Analytics... you can input them in one place or sheet for easy viewing.
The same goes for the marketing data you have by manually calculating other metrics. As well as the results of your external marketing efforts.
This is very helpful because we don't want our ecommerce data to be all over the place, right?
We want to keep them together to know how we can improve them.
The next way is...
3. Compare Your Previous Analytics
To ensure you're going nowhere but up... you need to compare your previous analytics with the recent one.
This will help you understand what you're doing right or wrong. If your reports are red, what could be the problem? If it's nothing but green, what are you doing right, and how can you improve them?
Don't get discouraged if you don't see any improvement.
Because that's the goal of understanding your ecommerce data analytics... to optimize your marketing efforts and enhance your ecommerce store.
Another way is...
4. Track Consumer Behavior
Are some of your metrics decreasing? One of the best ways to understand this is by tracking consumer behavior and analyzing customer data.
But... different factors affect consumer behavior.
It can be seasonal changes or real-world events. Or maybe you need to optimize your website and digital marketing efforts, right?
Knowing these factors will help you acknowledge opportunities to increase your online sales.
And last but not least...
5. Keep An Eye On The Performance Of Your Products
I know that the overview dashboard is really convenient and helpful.
But you might still want to see how each product or which product categories are performing well.
If you see a massive increase in sales in the past month... you might want to ask yourself which products are driving the most profits or sales.
Let's say you own an ecommerce retail (e-tail) store.
If you see that a lot of your customers are ordering denim pants from your ecommerce store... you might want to make sure you can keep up with the demands.
Remember, tracking your analytics can help you be more proactive.
That's why this is one of the best ways to understand your ecommerce analytics.
As I said above, analytics can help you make informed actions and decisions in the future.
But aside from that, you can also...
Be One Step Ahead Of Your Competitors!
Understanding your analytics can help you step up your game and be one step ahead of the competition!
You can determine what's wrong and if there's room for improvement on your ecommerce store to make sure you can drive more visitors and sales!
Now you know your numbers and how to optimize them... it doesn't stop there!
Because the optimizing process involves tools and apps...
Luckily, there's an ecommerce theme that can help you with this. It gives your ecommerce store a great look without compromising its functionality...
And it's Debutify!
It has over 50+ Add-Ons that will help you optimize your store's "looks and feels" while increasing your profits, AOV, and conversions!
Sounds exciting, right?
Optimize Your Ecommerce Store For Conversion With Debutify - Today!
14-Day Free Trial. 1-Click Installation. No Credit Card Required.